

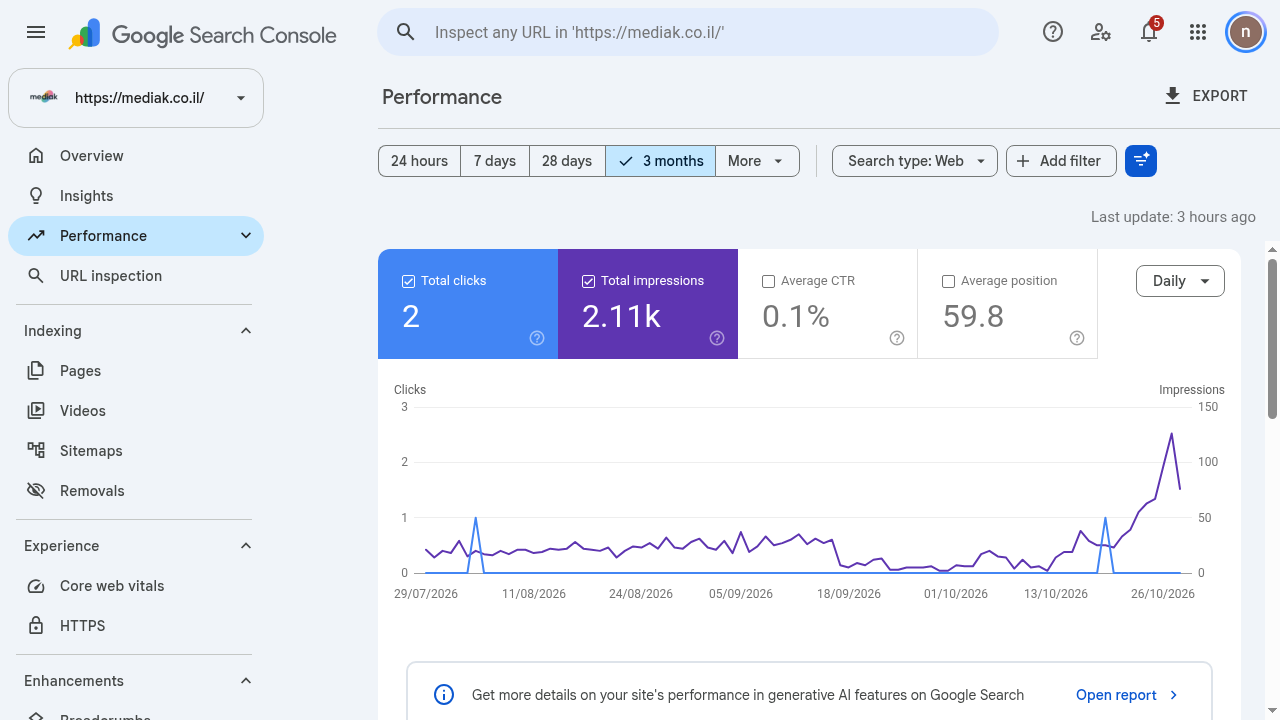
The Performance report shows how your site appears in Google Search results: which queries display it, how many people see it, and how many actually visit. This is the report you will return to most often.
Step 1: Opening the Report
Select your property in the property selector and click Performance in the side menu. The default view shows Clicks and Impressions from standard search results (Web) over the last 3 months.
Step 2: Understanding the Metrics
Total clicks (Clicks) - How many times users clicked on your site from search results.
Total impressions (Impressions) - How many times the site appeared in search results.
Average CTR (CTR) - Click-through rate: Clicks divided by Impressions.
Average position - The average position of your highest result.
Clicking a card toggles it on or off in the graph. The most recent data (dashed line) is preliminary and subject to change over the coming hours.
Step 3: Filtering by Period and Search Type
Date range (Dates): 24 hours, 7 days, 28 days, 3 months, or custom range (More), including comparing two periods (Compare). In the 24-hour view, graph points are hourly.
Search type: Switch between Web, Image, Video, and News.
Time granularity: Daily, weekly, or monthly - weekly and monthly smooth out fluctuations and show trends.
Add filter (Filter): Filter by query (Queries), page (Pages), country (Countries), device (Devices), or search appearance (Search appearance).
Step 4: Reading the Table
Below the graph, the table groups data by the dimension selected in the tabs:
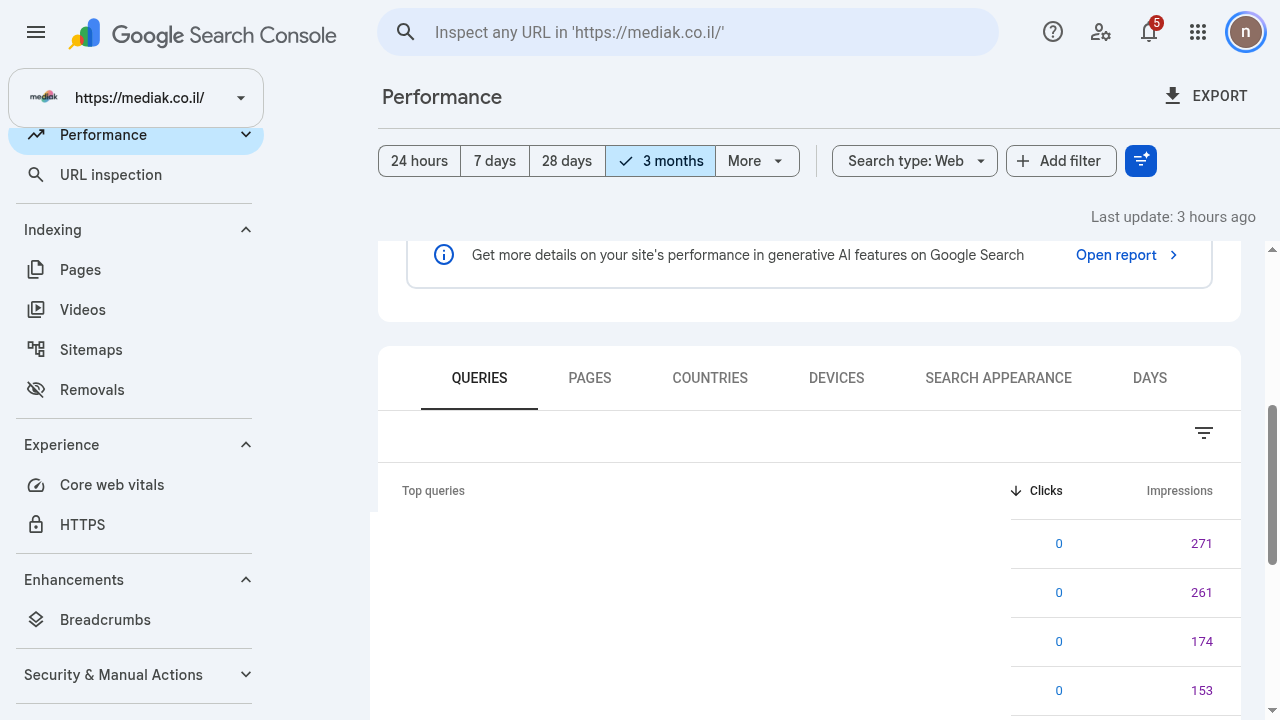
Queries table in the Performance report (actual screenshot; query text removed).
Queries - The queries that displayed the site, with Clicks and Impressions for each. Even if a query appears here, you may not see the site when searching yourself - results depend on time, location, device, and the searcher's browsing history.
Pages - Which pages receive the traffic.
Countries and Devices - Where traffic comes from and from which devices.
Search appearance - Which types of results (e.g., rich results) displayed the site.
Please note: In the graph, data is counted at the property level (two links from the same site for the same query count as a single impression), whereas in the table, it is counted at the row level - therefore, the totals do not always match.
Step 5: Exporting the Data
The Export (EXPORT) button at the top of the report downloads the data to Google Sheets, Excel, or CSV - convenient for periodic reports and sharing with clients.