
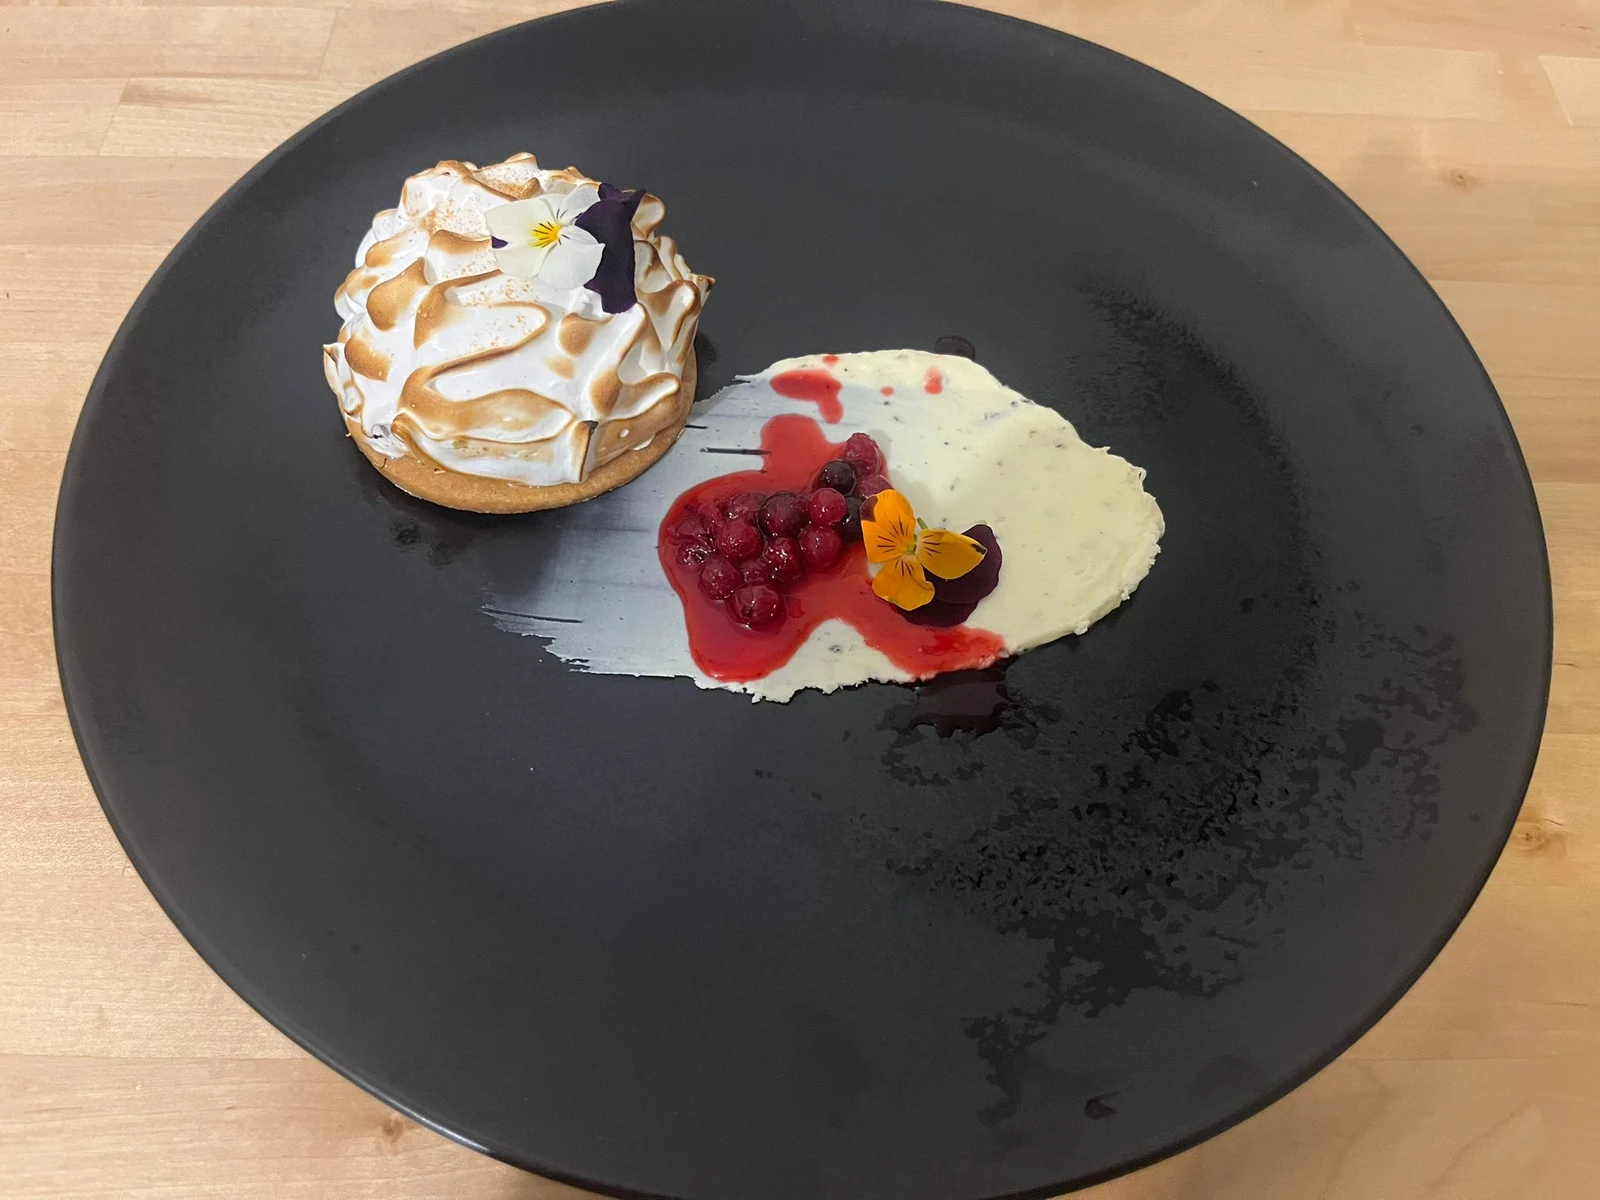
A photo from chef Rani's website project. This case study covers the search campaign, separate from the website build.
The background: first define where you want to get
Rani is a private chef in the north of Israel, offering private events and cooking workshops. He is busy with the work itself and not free to answer ten new enquiries a day. So before we built the campaign, it was important to set a clear, realistic target: a number of clients that matches what he wants and what he can deliver.
The goal was not to increase the ad budget or generate as many enquiries as possible. We looked for the right people, in a quantity Rani can handle. By the client's report, his close rate is 40%, and the volume of clients coming from the activity exactly matches the number he is looking for.
The challenge: reaching an audience that is ready to book
In the launch month, the average cost per click was ILS 8.96. On a small budget that is a significant constraint, but the challenge was not only the click price: we needed to reach people who were already ready to book, without wasting the budget on an audience that was just starting to look around.
That required a precise messaging funnel, from the search to the enquiry, and a small number of exact keywords only. More traffic would not necessarily have been a better result. The goal was to reach relevant demand that Rani could turn into clients, without flooding him with enquiries he could not answer.
What we did
We focused the search campaign on Rani's area of activity and on keywords with booking intent. We matched the ad messaging to the searches, to connect what the person is looking for with the service they can book. In February we updated the ad copy.
Throughout the activity we added negative keywords to filter out searches that do not fit the service. In April we paused 34 keywords. The focus was on keeping fewer searches, but ones that better fit the goal and the budget.
In March we updated the conversion goals in the Google Ads account. The measurement referred to digital actions such as contacting, an outbound click or a call, to track the actions the system attributes to the ads.
The results: ad performance and the effect on the business
Between January and May there were 3,892 impressions and 647 clicks, with a total media spend of ILS 2,709.96. The average cost per click fell from ILS 8.96 in January to ILS 3.67 in May. The number of clicks rose from 26 in the partial launch month to 199 in May.
Between March and May, 53.01 attributed conversion actions were recorded: 13 in March, 19 in April and 21.01 in May. The cost per conversion action fell from ILS 50.71 in March to ILS 34.73 in May, a drop of about 31.5%. Search impression share rose from 24% in the launch month to 48% during the activity.
A 40% close rate, in the quantity that suits Rani
By the client's report, Rani closes 40% of enquiries and receives exactly the number of clients he is looking for. That is the important business measure in this case: reaching a target that fits his capacity, without spending large sums and without chasing more enquiries just to inflate the number.
The close rate is a figure provided by the client, separate from the Google Ads data. No number of closed deals is derived from the conversion actions.
Attributed conversion actions by month
Cost per attributed conversion action
Comparison for March-May only, after the conversion goals were updated. There is no cost-per-closed-client figure here.
Clicks by month
A conversion here is a digital action measured in Google Ads, not necessarily a unique enquiry or a closed client. In January and February, zero conversions were recorded; the conversion goals were updated in March, so we compare the improvement in cost per conversion between March and May.
January
- Impressions
- 262
- Clicks
- 26
- Spend
- ILS 232.84
- Cost per click
- ILS 8.96
- Attributed conversion actions
- 0
- Cost per conversion action
- Not shown
February
- Impressions
- 780
- Clicks
- 113
- Spend
- ILS 413.61
- Cost per click
- ILS 3.66
- Attributed conversion actions
- 0
- Cost per conversion action
- Not shown
March
- Impressions
- 727
- Clicks
- 134
- Spend
- ILS 659.22
- Cost per click
- ILS 4.92
- Attributed conversion actions
- 13
- Cost per conversion action
- ILS 50.71
April
- Impressions
- 955
- Clicks
- 175
- Spend
- ILS 674.62
- Cost per click
- ILS 3.85
- Attributed conversion actions
- 19
- Cost per conversion action
- ILS 35.51
May
- Impressions
- 1,168
- Clicks
- 199
- Spend
- ILS 729.66
- Cost per click
- ILS 3.67
- Attributed conversion actions
- 21.01
- Cost per conversion action
- ILS 34.73
January is a partial launch month. The account total is ILS 2,709.96; adding the displayed monthly spend values gives ILS 2,709.95 due to display rounding.
What it means for the business
Sometimes you don't need to pour in large sums to reach the target. You need to set a clear, realistic goal, understand how many clients the business can take, and build the advertising around it. For Rani, a small budget, precise searches and messaging aimed at an audience ready to book connected with his close rate and his work capacity.
Success here is not maximum enquiries. It is the right number of clients for Rani, at a budget that suits the business.