

Hebrew source: https://mediak.co.il/guide-625
A useful report turns advertising data into decisions: which ads to stop, where to allocate budget and when creative may be losing effectiveness. This guide explains how to build a report, interpret the results and compare them with business outcomes.
Start with the optimization question
Before building the report, define the question you want to answer. For example: "Does this campaign produce conversions at a lower CPA than the other campaign?"
The question determines the columns, attribution settings and breakdowns needed. A report with every available metric is not necessarily easier to use.
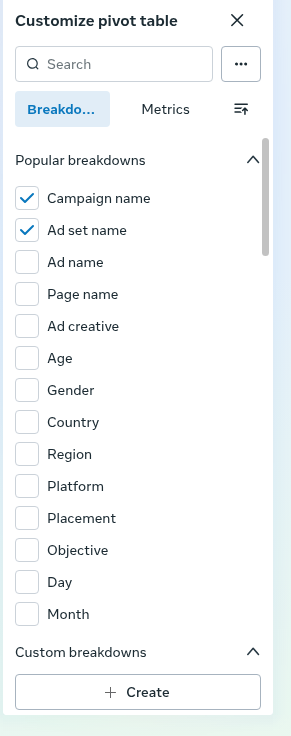
Example report breakdown selector. Available breakdowns depend on the report and setup; this image does not show an attribution-window comparison.
Custom metrics across the funnel
Alongside default columns, the source guide describes custom metrics under Columns > Customize columns > Create custom metric. Labels and availability can differ between accounts.
Hook rate
An example formula is:
(3-second video views / impressions) × 100
Practitioner benchmarks used in this guide include 25% or more as favorable and below 20% as a reason to review the opening. These are not Meta quality thresholds and should not be treated as universal targets across formats, audiences and campaign objectives.
Hold rate
The source uses:
ThruPlays / 3-second video views
If displayed as a percentage, the formula and display format must produce the intended percentage exactly once. The source's example benchmark is 25% or more, again as a practitioner reference rather than a platform rule.
Add-to-cart rate
An example formula is:
(Add to cart / link clicks) × 100
One practitioner ecommerce reference range is 3% to 4%. Use the business's own history and funnel definition rather than assuming this is a universal industry average.
Check the number format
The source guide warns against multiplying by 100 both in the formula and in the display format. Verify the selected format with a known example before relying on the result. For instance, 25 qualifying events from 100 impressions should display as 25%, not 2,500%.
Meta's own custom-metric instructions offer Numeric, Percentage and Currency formats as separate choices. They do not prescribe Number for every rate. Match the formula and display format, then verify a known example before using the result. A ratio of 25 / 100 represents 25%; do not apply percentage scaling twice. Source:https://www.facebook.com/business/help/698045821051774
Attribution and conversion counts
A single Results column does not explain how conversions were attributed or whether a person converted more than once.
Attribution-setting breakdowns
Available attribution breakdowns may include rows such as 1-day click, 2-to-7-day click, 1-day engagement and 1-day view where those reporting options are available.
These categories use different attribution rules. They do not by themselves prove the ad caused a conversion or identify every other channel involved. Read Meta's definition of the selected category and compare it with the business's measurement needs.
Conversion-count breakdowns
Where available, a conversion-count breakdown distinguishes a first conversion from other conversions. Repeated purchases or sign-ups can be legitimate events. Decide whether the question concerns people, purchases or all conversion actions before interpreting repeated events as inflation.
Comparing attribution settings
The comparison controls can add side-by-side columns for supported windows that differ from the ad set's selected setting. Check which windows are currently offered; do not assume a historical 28-day click option is available in every account or report.
Analyze the campaign, ad set and individual ad
Use the reporting hierarchy in stages:
1. Campaign level for overall allocation and performance.
2. Ad set level for audience and bid comparisons.
3. Individual ad level for creative performance.
A campaign ROAS of 2.5× can hide a strong ad and several weak ads. Inspect the underlying spend and conversion distribution rather than treating the campaign average as the result of every ad.
Saved reports, export and scheduling
After choosing columns and breakdowns:
- Save the report configuration in Ads Reporting.
- Export CSV or Excel where supported for analysis outside the platform.
- Review any available daily, weekly or monthly email scheduling options.
Meta supports recurring email for single-account reports, not cross-account reports. Its help page lists administrator, advertiser or analyst ad-account access as a prerequisite and states that only people with permissions on the account can access the report. For others, it suggests exporting and sending the report file. Exporting or sharing still requires the account owner's permission. Source:https://www.facebook.com/business/help/596403700379202?id=369013183583436
Compare platform data with business systems
CTR, CPC and CPM
CPM reflects the cost of buying impressions in the auction. High CPM alongside good CTR and business outcomes may be acceptable; cheap impressions with no useful conversions may not be.
Low CPC and high CTR without conversions are reasons to inspect tracking, the offer and the landing page. No single combination proves where the problem is.
Pixel and Conversions API
Using Conversions API alongside Pixel can improve measurement coverage where configured correctly. Check event matching and deduplication. It does not guarantee complete or perfectly accurate attribution.
UTM parameters
Use consistent UTM parameters and compare the resulting data with website analytics and internal sales or lead records. Differences in consent, attribution models and reporting time can produce different counts.
Marketing efficiency ratio
MER is total revenue divided by total marketing spend. It is a broad efficiency ratio, not a profit measure by itself. Product costs, fees, overheads and margins still matter when assessing profitability.
Practical reporting checks
Do not rely only on averages
One strong ad can conceal weak ads in a campaign-level average. Review spend and results at the level where the decision will be made.
Separate attribution categories
Where the report supports it, compare click-through, view-through and engagement-based attribution. Also check whether results represent first or repeated conversions.
Recognize changes in the measurement rule
Changing the attribution window can change reported ROAS without an equivalent change in the business's underlying performance. Compare like with like and record when measurement settings changed.
Separate acquisition and retargeting
Retargeting often reports stronger ROAS because those people already know the business. Review new-customer acquisition separately instead of allowing retargeting to hide weak acquisition.
Match metrics to the objective
Likes, shares and comments do not by themselves show purchases. Unless the purpose is awareness or engagement, give priority to the selected conversion action and downstream business quality.
Sources: Jon Loomer's article supports the distinctions between attribution breakdowns and comparison columns:https://www.jonloomer.com/meta-ads-attribution-reporting/ . Meta's owning help supports the format options and scheduled-email scope described above. These documentation checks do not substitute for inspecting the controls available in a particular ad account.