

Hebrew source: https://mediak.co.il/guide-585
Introduction
Analyzing ad reporting in TikTok Ads Manager can be misleading if judged by the same metrics used for Google or Meta. TikTok is a discovery platform (Discovery Platform), so the customer journey on it is non-linear: many users watch an ad, visit the profile, do not click immediately, and only later search for the brand on Google or purchase directly. Relying exclusively on last-click conversions (Last-Click CPA) makes TikTok appear weaker than it actually is. Conversely, blind trust in every conversion the platform attributes to itself presents an exaggerated picture. This guide is based solely on documented experience from advertisers, analytics experts, and agencies in the field, presenting the tools and metrics for reading the true data.
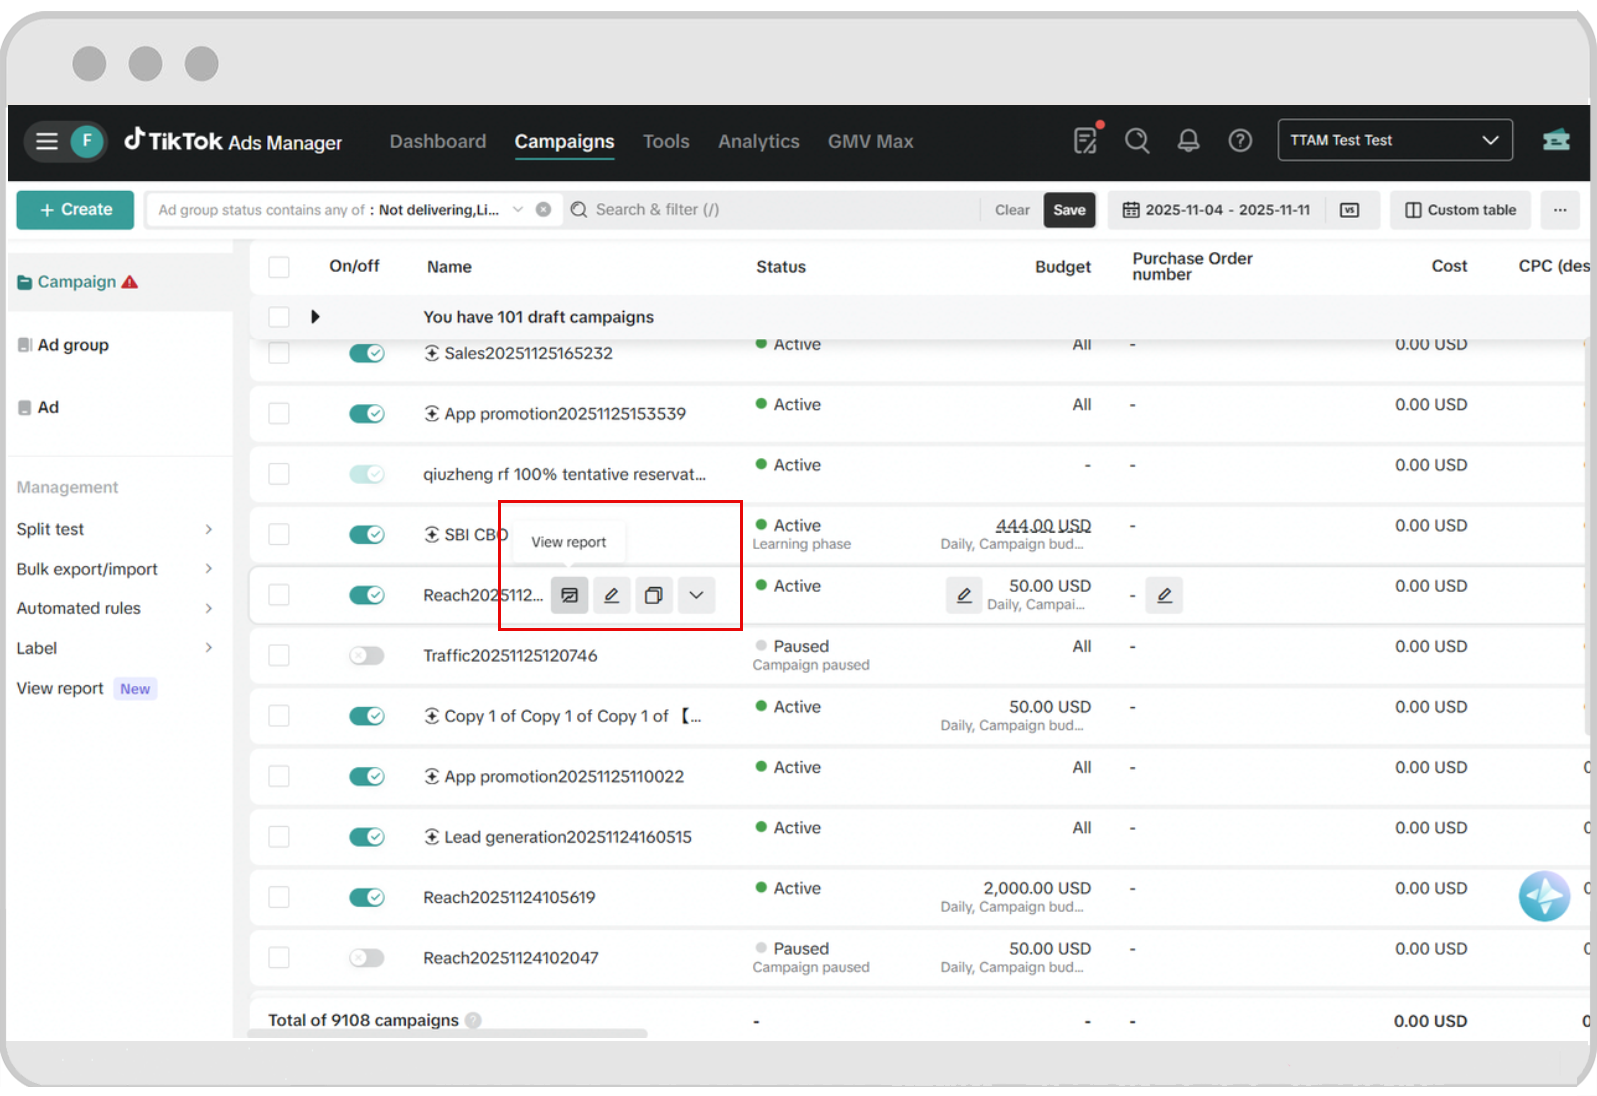
Example of the row-level report control in Ads Manager. This is an interface screenshot, not an official help-page screenshot or a performance result.
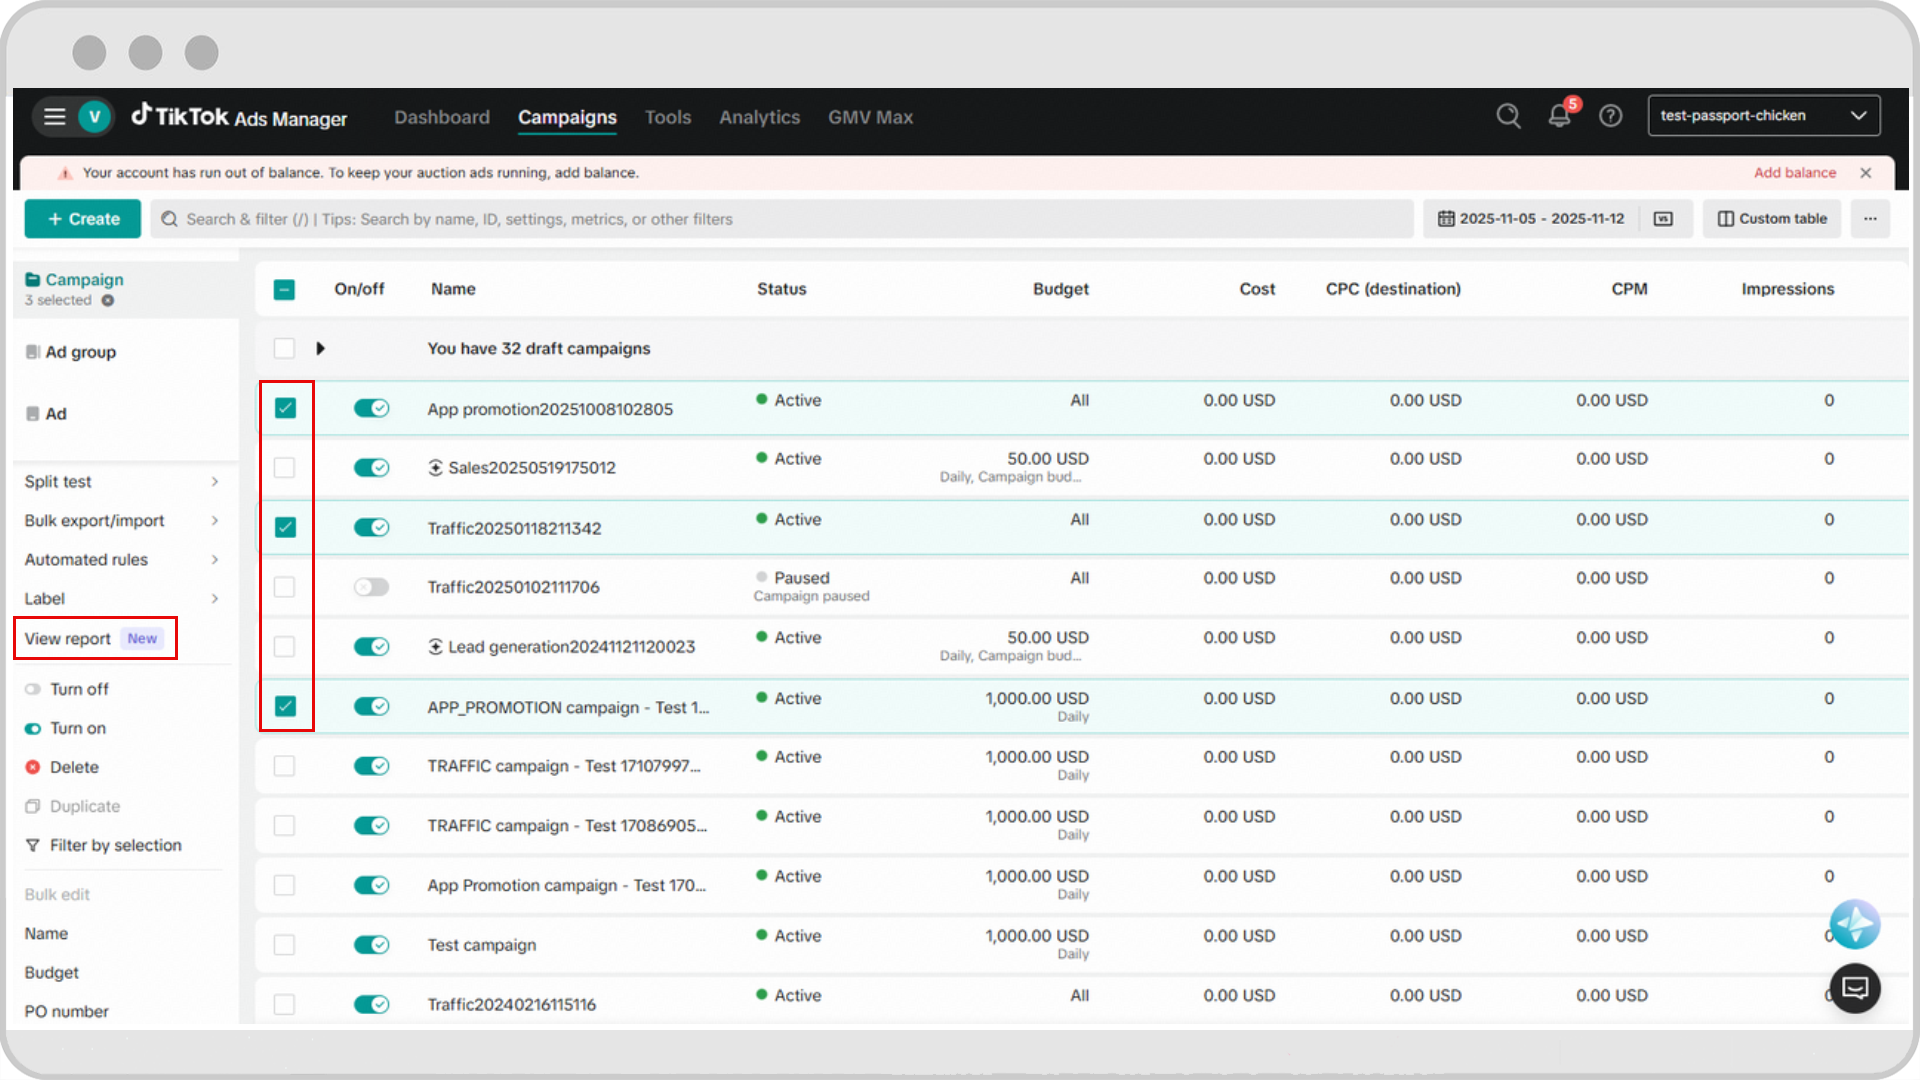
Example of opening a report from selected campaigns. The test-account dates shown are in November 2025; the table is not evidence of campaign performance.
Building a Custom Dashboard (Master Column View)
Kiril Ivanov, performance marketing expert from AdsManagement.co (an advertising agency, so commercial interest should be considered), explains that the platform's default reporting view is insufficient for decision-making. Ivanov recommends building and saving a custom column view (Custom Columns) consisting of five main metric groups:
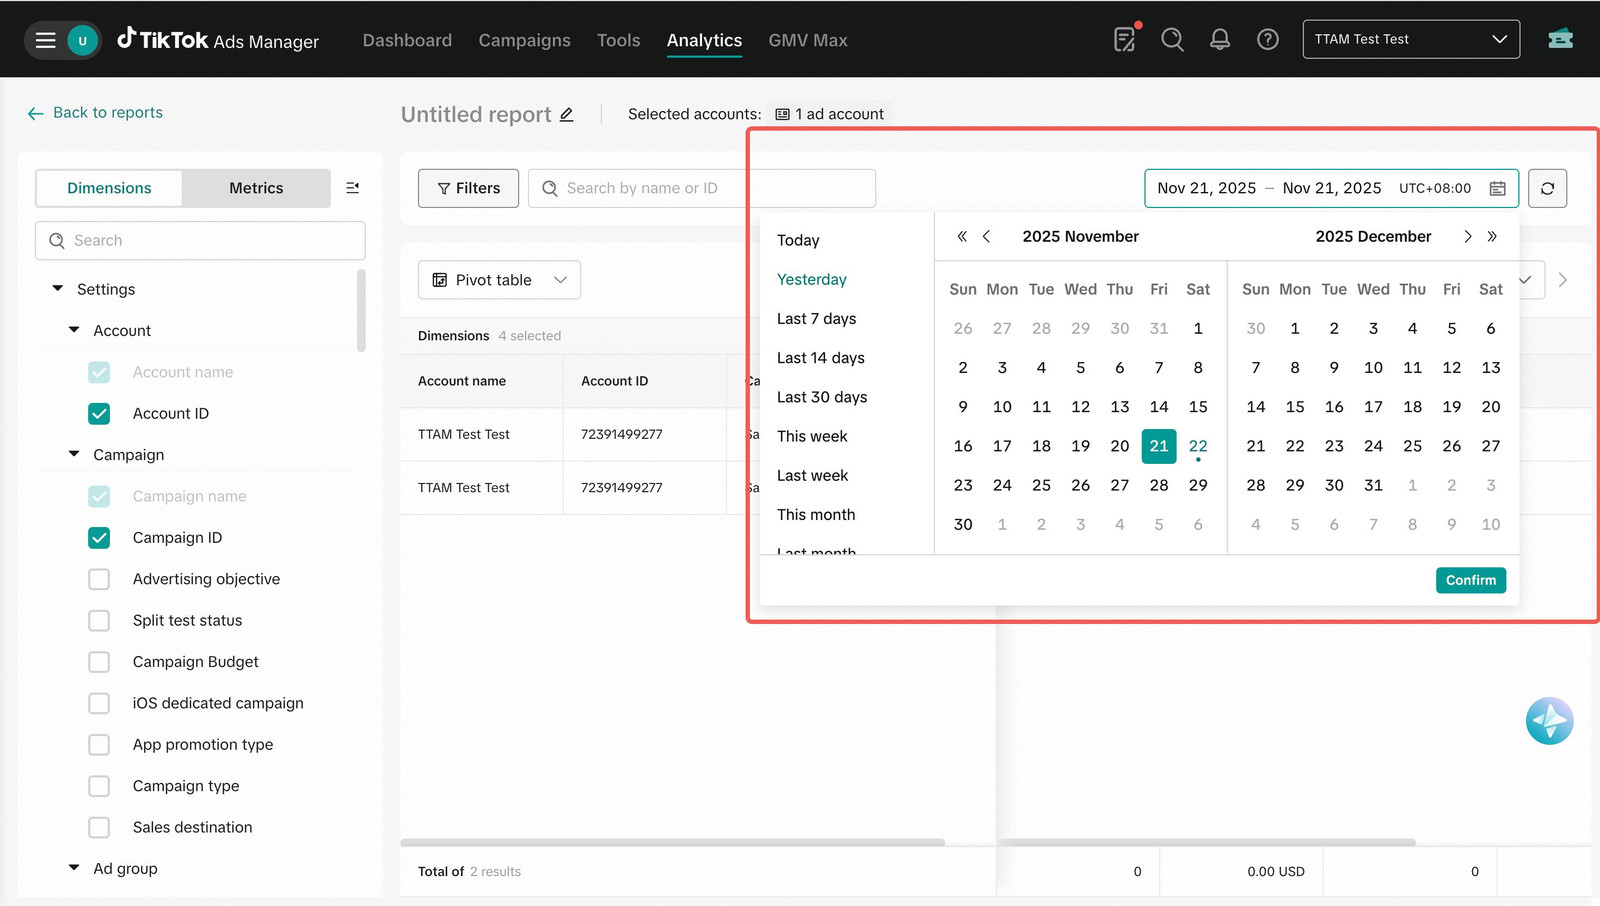
Example report-building controls, with a November 2025 date selection. Check the dimensions and metrics available in the current account.
Delivery Metrics (Delivery): Spend, Impressions, Reach, Cost Per Thousand Impressions (CPM), and Frequency.
Traffic Metrics (Traffic): Clicks, Click-Through Rate (CTR), Cost Per Click (CPC), and Landing Page Views.
Video and Retention Metrics (Video): 2-second views, 6-second views, Average Watch Time, and view completion rates (25%, 50%, 75%, 100%).
Engagement Metrics (Engagement): Likes, comments, Shares, follows, and Profile Visits.
Conversion and Attribution Metrics (Conversion & Attribution): Conversions (Purchase/Complete Payment), Cost Per Acquisition (CPA), Return on Ad Spend (ROAS), purchase value, Click-Through conversions, View-Through conversions, and Engaged View-Through conversions (EVTA).
Video Metrics and Diagnostics: Hook Rate and Hold Rate
Ivanov explains that video metrics show whether the creative is doing its job even before the user clicks on the ad. He presents two key formulas for diagnosis:
Hook Rate (attention capture rate): Hook Rate = (2-second video views / impressions) * 100
Hold Rate (view retention rate): Hold Rate = (6-second video views / impressions) * 100
Practitioner diagnostic ranges according to Ivanov, not universal TikTok thresholds:
Hook Rate: below 20% is considered weak, 25%-30% average, above 35% strong.
Hold Rate: below 6% is considered weak, 8%-10% average, above 15% strong.
Numbered Steps for Creative Diagnostics and Decision-Making
According to Demand Curve's guide and Ivanov's analysis, the recommended sequence of actions for testing and diagnosing ads is:
Running for 3 Full Days: Flowing budget to test 3-6 significantly different ads in each ad group for 3 full days without changes.
Diagnosing Creative Issues by Video Metrics:
Low hook rate: test whether the opening image, first words or audience-message fit need work.
Strong hook rate but low hold rate: inspect whether the opening promise is sustained by the rest of the video.
Strong hold rate but low CTR: review the call to action, offer and relevance of the next step.
High completion but low conversions: inspect tracking, the offer and the landing-page flow. Completion alone does not identify the cause.
Making Budget Decisions Based on CPA Results:
A practitioner scaling example is to increase budget by 20% every three days while watching CPA and business outcomes. It is not a guaranteed safe step for every campaign.
When CPA is near the target, review volume, reporting delay and variation before changing the test.
A CPA above target is a reason to review spend, sample size, reporting delay and business limits. Do not treat one early high-CPA result as a universal instruction to stop immediately.
Attribution Windows, Assisted Conversions, and Profile Engagement
Attribution and Assisted Conversions
Kiril Ivanov details the types of weight the system assigns to conversions:
Click-Through Attribution: The user clicked on the ad and converted later within the attribution window.
View-Through Attribution (VTA): The user watched the ad and converted later without clicking.
Engaged view-through attribution assigns credit after a qualifying video view followed by a conversion within the selected window. Ivanov describes a six-second or completed-view condition; check the current definition and supported attribution window for the account rather than applying this as an account-wide constant.
Ivanov notes that the Assisted Conversions report in TikTok Attribution Analytics shows how TikTok generates initial exposure, while Google, email, or direct traffic complete the purchase.
The Importance of Profile Visits
Ivanov clarifies that profile visits are a critical trust metric on TikTok. Many users click on the profile name to check if the brand is real, watch organic videos, and only then proceed to the website. If an advertiser flows budget and directs traffic to a profile empty of content, the opportunity is wasted.
Errors Reported by Advertisers
Experts and advertisers point to common data analysis failures:
Judging all campaigns solely by Last-Click CPA: Ivanov warns that analyzing a TikTok campaign through the lens of a Google Search campaign ignores TikTok's role in generating demand that converts on other channels.
Bid or budget changes: Demand Curve's historical guide warns against large changes and uses 20% as its working limit. Treat this as source guidance, not proof that every change above exactly 20% necessarily resets learning in every current campaign type.
Metric overload in the dashboard: Ivanov warns against flooding reports with dozens of metrics unrelated to the campaign objective.
Misinterpreting Shares: Ivanov notes that sharing an ad is not always a positive sign. It is mandatory to check the comments: if people share the video because the claim in the ad is unbelievable or confusing, it represents a brand image problem rather than a success.
Where Sources Differ or Are Unclear
1. Platform Attribution vs. Independent Measurement (Geo-experiments / Blended ROAS)
Kiril Ivanov discusses Ads Manager alongside GA4 and assisted conversions. In a June 7, 2022 article, Billy Ryan, then head of analytics at the7stars, described TikTok's advertiser proposition as still developing. That is historical commentary, not a current assessment of the platform. Source:https://uk.themedialeader.com/opinions/how-to-de-code-tiktok-and-what-to-ask-tiktok-for/ Ryan recommends that brands not rely solely on platform data, but rather conduct independent geo-experiments (Geo-experiments) and incrementality measurements (Incrementality) to verify whether TikTok actually generates incremental sales beyond the existing mix. Demand Curve's guide offers a third approach to handle iOS 14 data loss: ignoring in-app ROAS and switching to a Blended ROAS metric (total daily revenue across all channels divided by total ad spend across all channels, targeting a 2x-4x range), alongside using post-purchase surveys (Post-purchase surveys) and dedicated coupon codes (such as TIKTOK15).
2. Structural Discrepancies Between TikTok Ads Manager and Google Analytics (GA4)
Comparing TikTok with GA4 requires matching event definitions, reporting dates, attribution windows and report scope. Google distinguishes user-, session- and event-scoped traffic dimensions: user/session dimensions use paid-and-organic last-click attribution, while event-scoped reporting uses the selected model. GA4 is therefore not simply a single-session conversion model. Investigate missing events and UTM handling separately from differences in attribution; a discrepancy is not proof that implementation is correct. Primary sources:https://support.google.com/analytics/answer/11080067?hl=en andhttps://support.google.com/analytics/answer/10597962?hl=en